
Mapping street level crime in an area
A little while ago I was playing around with the API at data.police.uk looking at a way to pull the data into a google spreadsheet (and some of the issues around the way policing areas are constructed)
Yesterday I found myself playing with the API again and looking at quick and easy ways to pull data out based on a particular area.
Before I go any further I’d recommend that if you’re going to do anything with crime data from data.police.uk, you read the About pages*** for more information on what the data means and where the limitations are. ***
Back to the project…
I know that the data.police.uk API can deliver street level crime reports based on a number of criteria including multiple latitude and longitude points that describe a shape.
I wondered how easy it would be to get the points of a custom polygon, like the one below, so I could get more specific data.
So I created a basic polygon using Google MyMaps and set about seeing if I could get the data out.
Making the shape
The easiest way to get at the data used to describe the polygons is by exporting the map as a KML file. In Google My Maps:
- In the left panel, click Menu (it looks like three dots on top of each other)
- Select Export as KML.
- You can choose the layer you want to export, or click Entire map. I just picked the layer with the Polygon on.
- Click Export.
Sorting out the lat and long points
The file that is exported is a text file so we can open up the file in any text editor and it will look something like this (I’ve just included the first part) and it’s those co-ordinates that I want to get at.
<?xml version='1.0' encoding='UTF-8'?> <kml xmlns='[http://www.opengis.net/kml/2.2'](http://www.opengis.net/kml/2.2%27)> <Document> <name>Crime Layer</name> <Placemark> <name>Crime area</name> <styleUrl>#poly-000000-1-77-nodesc</styleUrl> <Polygon> <outerBoundaryIs> <LinearRing> <tessellate>1</tessellate> <coordinates>-2.7231503,53.7637821,0.0 -2.7239227,53.763021,0.0 -2.720747,53.7586067,0.0 -2.7239227,53.7518067,0.0 -2.7229786,53.7493706,0.0 -2.7213478,53.7495229,0.0 -2.7176571,53.7501319,0.0 -2.715168,53.7485078,0.0 -2.7113915,53.7475942,0.0 -2.7094174,53.7476957,0.0 -2.7033234,53.7507917,0.0 -2.6967144,53.7516544,0.0 -2.6905346,53.7486093,0.0 -2.6857281,53.7488631,0.0 -2.6790333,53.7531769,0.0 -2.6811791,53.7566277,0.0 -2.6800633,53.7606363,0.0 -2.6809216,53.7612959,0.0 -2.6774883,53.7620063,0.0 -2.6780892,53.7630717,0.0 -2.6846123,53.7693626,0.0 -2.6918221,53.7693626,0.0 -2.7057266,53.7690583,0.0 -2.7167988,53.7671305,0.0 -2.7231503,53.7637821,0.0</coordinates> </LinearRing> </outerBoundaryIs> </Polygon> </Placemark>...
Sadly the co-ordinates are in the wrong format for data.police.uk;
- The lat and long are reversed
- The data.police.uk API wants each pair (lat and long that describes a point) separated by a colon (:)
So we are going to need to clean the data up a bit. You could take the data points and use various filters, formulas and other things (regex etc.)There’s plenty of ways we can do this but to be honest with such a small set of points I did it by hand.
The biggest issue is getting each pair on a new line. If you can do that then they should cut and paste into a spreadsheet and you can use the **SPLIT **command in Google Sheets to break the data down. Once you’ve got the Lat and long in adjacent columns then the **CONCATENATE **formula will help rebuild things in the right format and then the JOIN formula will shunt them back into one line.

The SPLIT formula can be used to separate lat and long using the comma as the delimiter (the thing you split on) Adding TRUE means it will split on consecutive commas

The CONCATENATE formula can be used to join the Lat and Long back together again in the right order, separated by a comma

Finally the JOIN formula helps shunt them all together on to one line, separated by the colon that data.police.uk wants for the API call.
Some final cutting and pasting and I ended up with this URL to call the API
https://data.police.uk/api/crimes-street/all-crime?poly=53.7637821,-2.7226353:53.763021,-2.7234077:53.7586067,-2.720232:53.7518067,-2.7234077:53.7493706,-2.7224636:53.7495229,-2.7208328:53.7501319,-2.7171421:53.7485078,-2.714653:53.7475942,-2.7108765:53.7476957,-2.7089024:53.7507917,-2.7028084:53.7516544,-2.6961994:53.7486093,-2.6900196:53.7488631,-2.6852131:53.7531769,-2.6785183:53.7566277,-2.6806641:53.7606363,-2.6795483:53.7612959,-2.6804066:53.7620063,-2.6769733:53.7630717,-2.6775742:53.7693626,-2.6840973:53.7693626,-2.6913071:53.7690583,-2.7052116:53.7671305,-2.7162838:53.7637821,-2.7226353
Notice that there is no trailing : and I’ve left the date option off. That will give me any street level crime reports, in the area defined for the last month they have. Plug that URL into a new browser tab and you get a page full of JSON data:
[{"category":"anti-social-behaviour","location_type":"Force","location":{"latitude":"53.764959","street":{"id":863936,"name":"On or near Carrol Street"},"longitude":"-2.690727"},"context":"","outcome_status":null,"persistent_id":"725ed090a9eda01c7b53e2e474005e78077bb6e9521a600d90b8a10383fbd05e","id":50943777,"location_subtype":"","month":"2016-08"},{"category":"anti-social-behaviour","location_type":"Force","location":{"latitude":"53.762666","street":{"id":862106,"name":"On or near Driscoll Street"},"longitude":"-2.690796"},"context":"","outcome_status":null,"persistent_id":"463cc6c50d3d8464a4f05d1e9f9d9e18d2138d0ba4b3d843daba7419660ddbaf","id":50939501,"location_subtype":"","month":"2016-08"},
Pulling the data into a spreadsheet
There are lots of applications and scripts that can read the JSON output from the Police API. But I wanted to go with something that required minimal coding and could output something pretty easily so I pulled the data into a google spreadsheet using the importJSON script. Making the script work is dead easy thanks to Paul Gambill’s guide to How to import JSON data into Google Spreadsheets in less than 5 minutes.

Using the importJSON script we can use the data.police.uk api call to populate a spreadsheet. (you should be able to click the image and go through to the spreadsheet)
Visualizing the data
Now that we have the data as a spreadsheet we could start to do some analysis, filtering etc. But we can get a quick win by using the spreadsheet to drive a map.
I went back to the map I used to create the polygon shape, added a new layer and then imported my crime layer spreadsheet into the map. A bit of crunching later and each crime was mapped as a point.
Conclusions
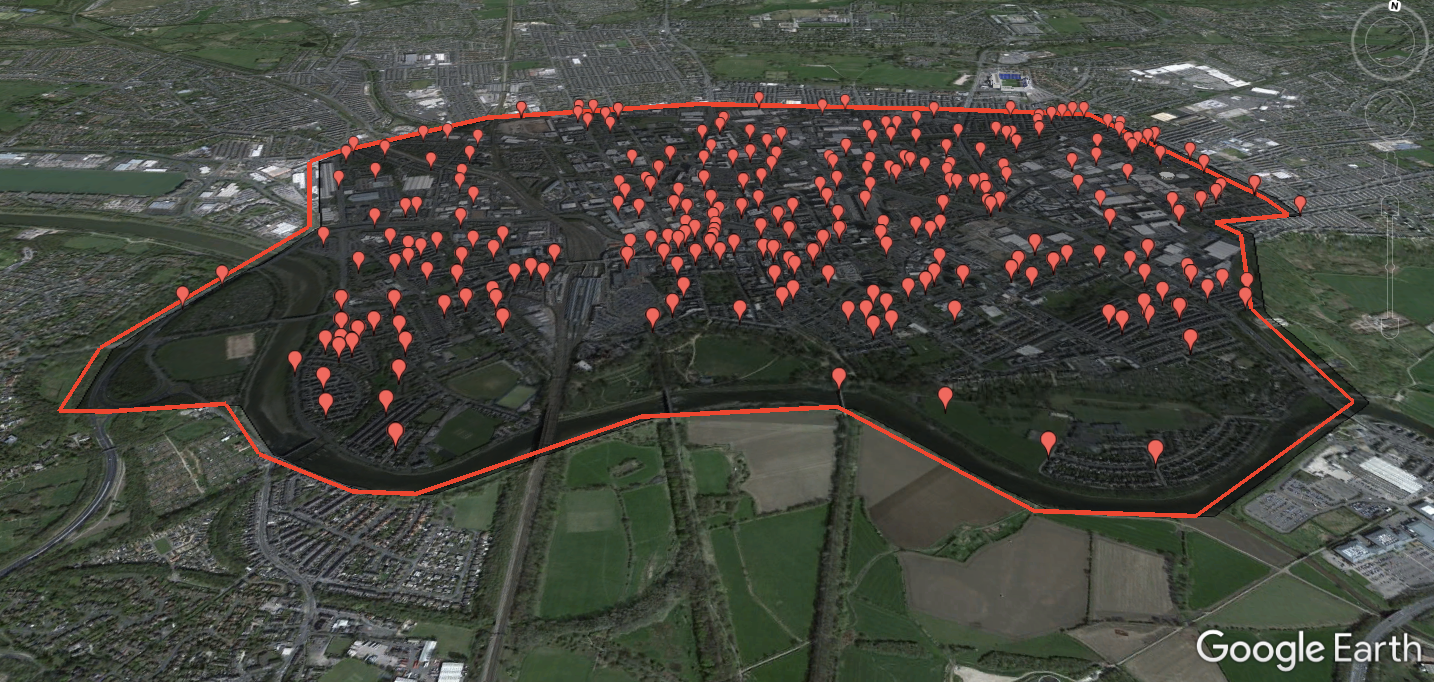
The API isn’t perfect — the data isn’t as fresh as I would like and the geolocation isn’t always accurate (they do say this to be fair). Google maps also has its quirks especially when you’re dealing with lots of data points. But being able to export to KML is nice feature, not only for pulling out polygon data. If you have Google Earth on your computer you can open the KML file and fly around the crimes in your area!

Exporting your Google Map as KML data means you can pull the data into Google Earth and fly around the crime locations
It’s clunky and no doubt there are more elegant solutions out there (please tell me if you know of them) but, a bit of messing with the format of the data aside, it worked how I thought it would; a process of ‘well I can do this, so if I can do that it should work’ way of piecing together the tools. As a quick and dirty visualization tool (and an exploration of what API’s can do), I think it works well.
Let me know if you try it!
**Note: The data from data.police.uk is made available under the Open Government Licence. That means you’re free to do pretty much anything with it but you must link back to the source where you can. **
Afterwards…
Jamie Whyte*** from the****** Trafford Innovation Lab****** reminded me that they had used the data.police.uk api to drive their ******Simplifying Crime Data for Local Authorities app. ***